Someone finishes signup
Event name
signup_completed - plan
- free
- signup_method
Count completed signups and use this event as the last step in your signup funnel.
Where are your visitors coming from? Why aren’t they signing up? StepMetrics lets you and your agent dig into the traffic and conversions of your website and app. Ask questions in the tools you already use, or open the dashboard and look for yourself.
No credit card required.
Ask your agent why visitors aren’t signing up, and it comes back with what to change first. It follows people through your signup steps, compares sources and devices, checks who comes back a week later, and names the step where you lose the most people. You get a short list of fixes with the numbers behind each one.
Example conversation · Sample data, not a live response
Why are so few visitors signing up?
Of 1,080 people who used the site this month, 280 started the signup form and 36 finished it, so most of the loss is on the form itself. Mobile visitors finish it at half the desktop rate, and visitors from search finish at twice the rate of visitors from social.
I’d shorten the form on mobile first. I’ve added a funnel for these steps and a completion-rate tile, so next week you can see whether the change worked.
The funnel, the rate and an alert for when an event stops arriving stay in your workspace, so the next conversation starts from numbers you already track. Your agent needs the key from Connect agent to add them; a read-only key can only look. See what your agent can read and set up.
Connect Claude Code, Cursor, or another MCP client to StepMetrics. Your agent can pull up traffic, pages, and conversions when you ask about them. It can also help install the tracker, so you can handle setup and analysis in the same conversation.
Example conversation · Sample data, not a live response
How did traffic change this week?
Your site had 240 visits this week, up from 180 last week. Search brought in 90 visits, compared with 35 last week. That accounts for 55 of the 60 additional visits.
Most of the increase came from search. I’d look at which landing pages gained those visits next.
Available on Free through MCP. This example uses illustrative weekly totals; your agent’s answer depends on the data your site has collected.
Your agent reads the same numbers as the dashboard. With a read key, MCP access is read-only. How agents read your analytics.
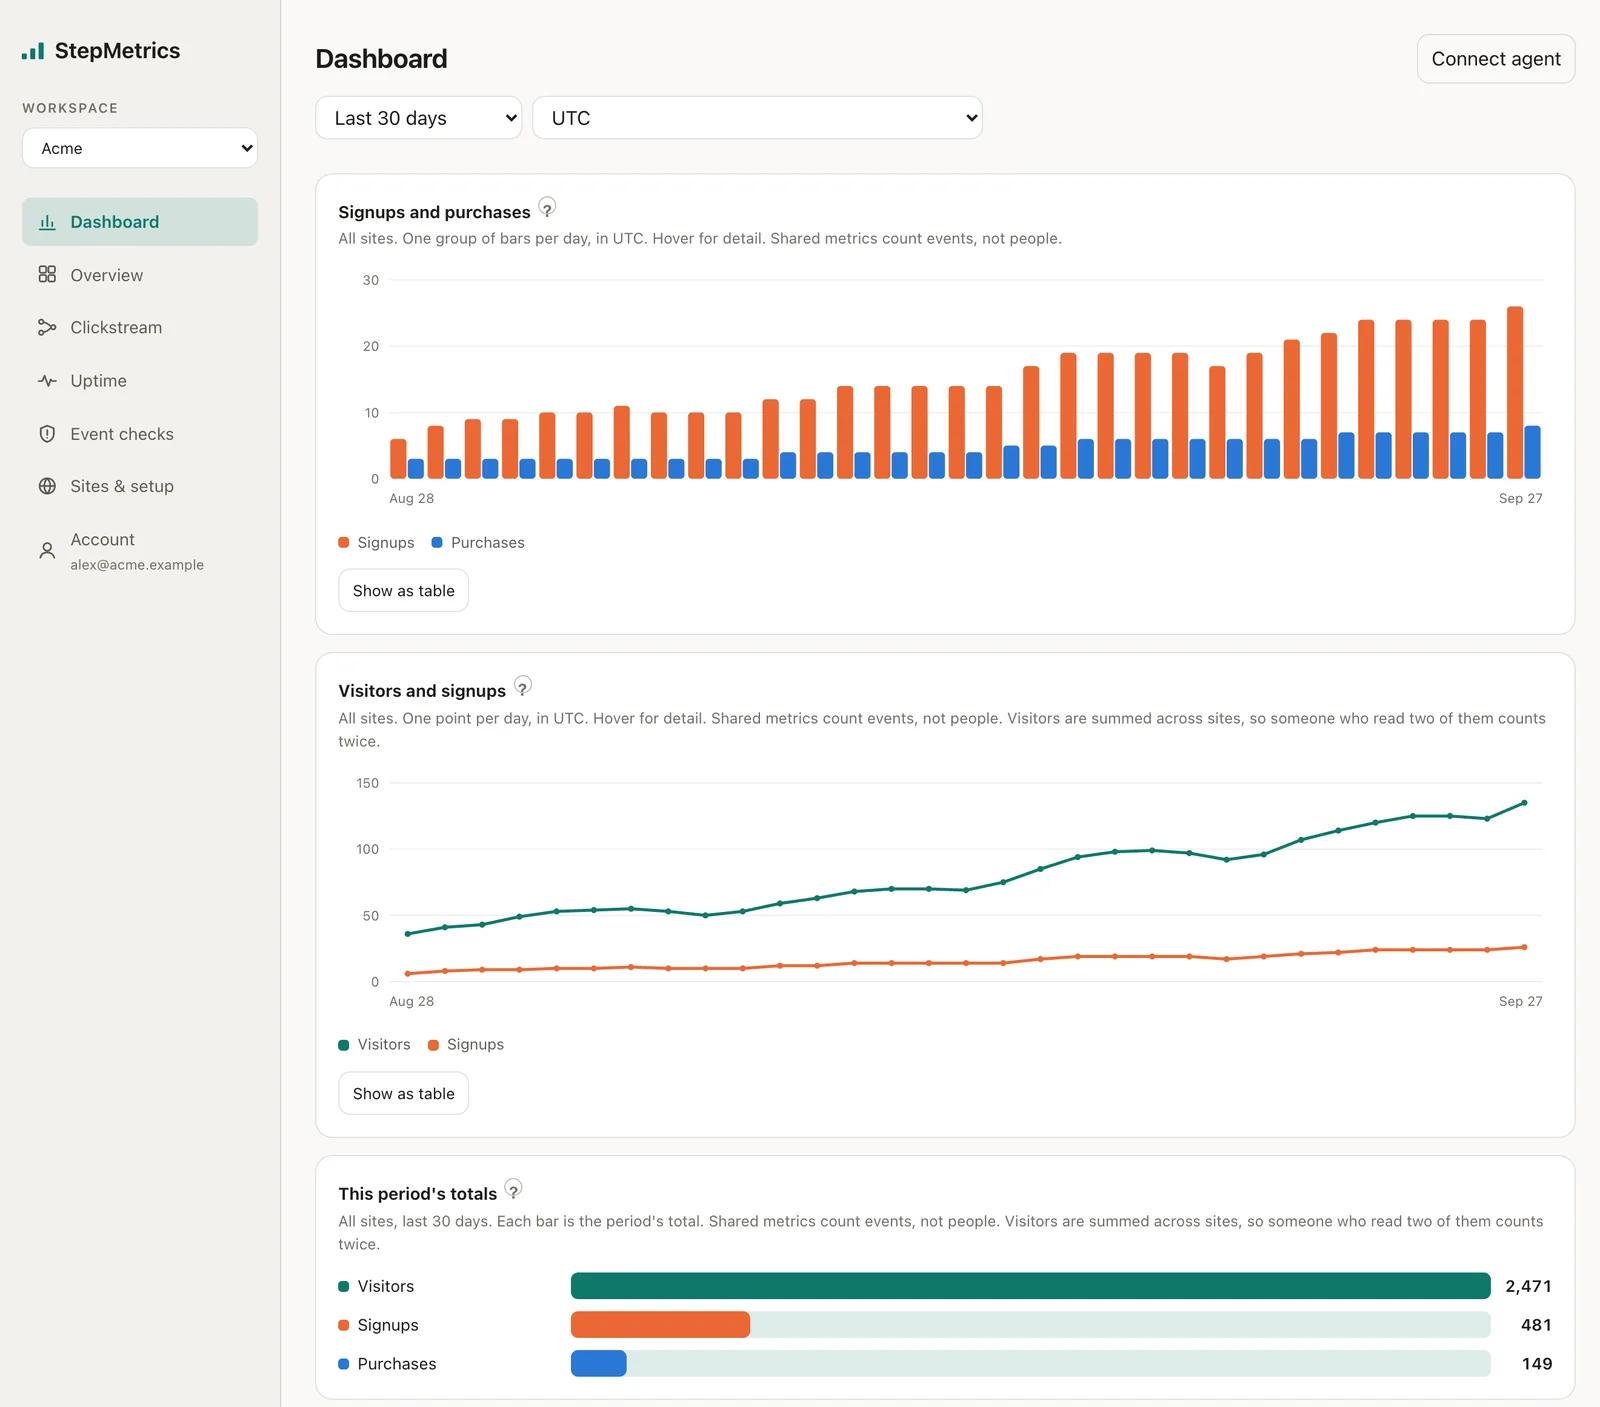
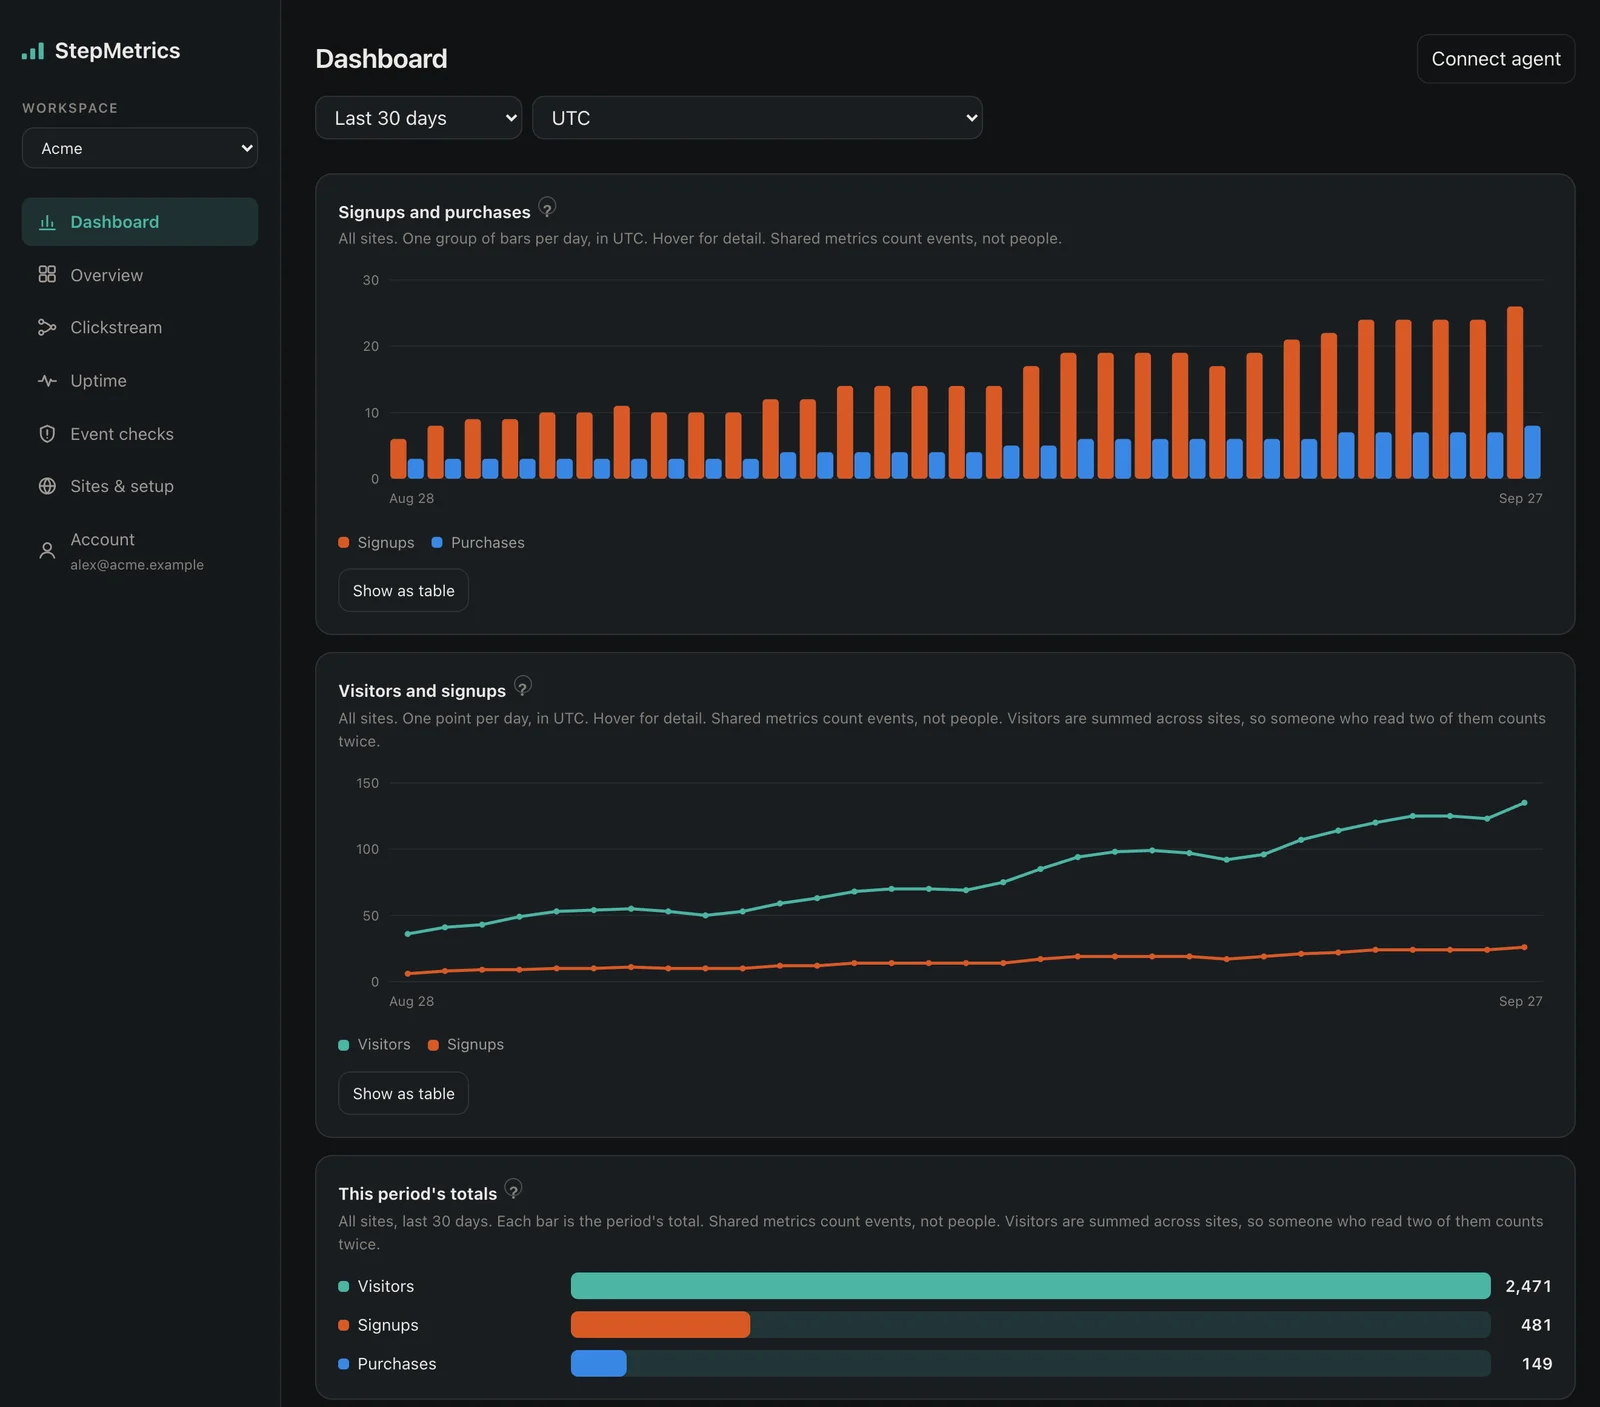
Tell your agent which charts you want to see, and they appear on your dashboard. Put signups, purchases and visitors from every site on one chart, each in its own colour, even when each site names its signup event differently. Move a chart to the top, show a trend as lines, or remove a chart you never look at, all by asking. There is no chart builder to learn.
Example conversation · Sample, not a live response
Put signups and purchases from all my sites on one chart, and move it to the top.
Done. “Signups and purchases” is now the first chart on your Dashboard page, one pair of bars per day. Signups combine the “signup” event on two sites with “registered” on the third.
The page starts blank and holds only what you ask for. Each workspace keeps its own; the key your agent gets from Connect agent can change it, and a read-only key can only look. See what a chart can show.
You’ve got visitors. How many make it through signup or checkout? Track those steps in StepMetrics and see where people leave. Break the results down by source or device to work out which page or flow to look at first.
Compare mobile and desktop visitors, or filter by traffic source. After changing a page, compare traffic and conversions with the previous period to see whether the numbers moved.
A funnel’s steps must fall within 24 hours, and a browser is followed across midnight by the tracker’s cookie. See how measurement works.
Of the 400 who opened the form, 100 finished. That’s a place to investigate.
A signup, a report export, a purchase: tell StepMetrics when it happens and include the details you want to keep. Send events from your website, server, or mobile app.
signup_completed Count completed signups and use this event as the last step in your signup funnel.
report_exported See how often people use exports. Keep the format and report type with each event.
purchase Record the purchase from your server when payment is confirmed, and include the amount paid.
Example events and values. You choose the names and when to send them.
Each event appears in your conversions list and is available to your agent. Use events as funnel steps to see how far people get. See how to send custom events.
Someone reached checkout but didn’t buy. Which pages did they visit first? Clickstream lets you look through the recorded pageviews and events from that visit, with timestamps, referrers, and event details.
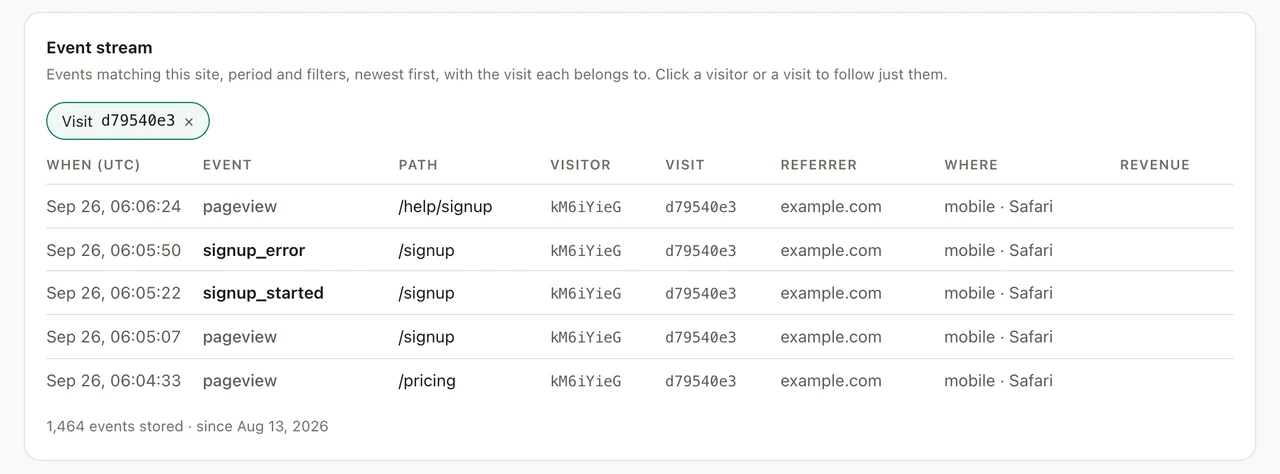
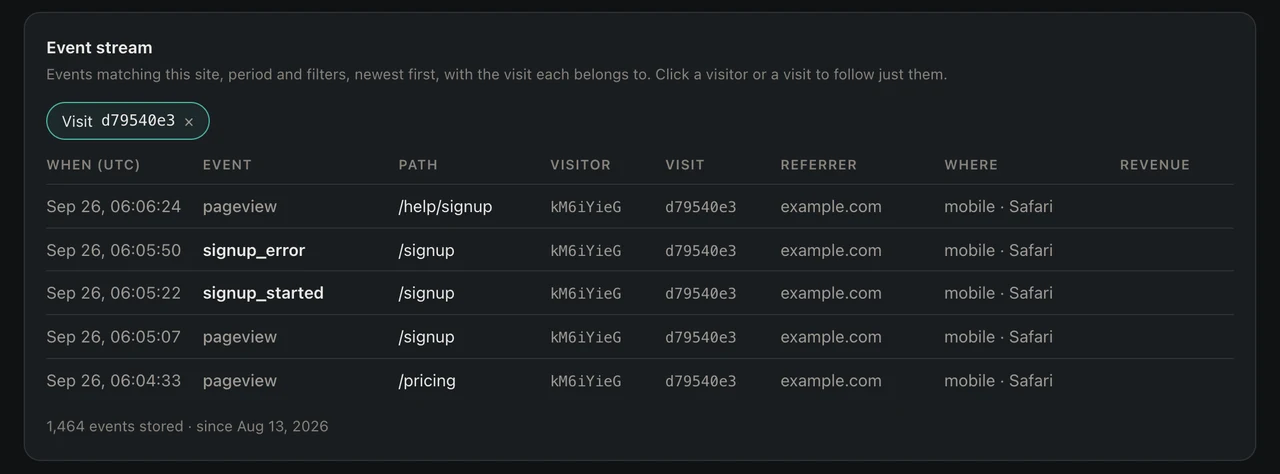
Clickstream shows the pageviews and custom events you collect. It doesn’t record a video of the visit or automatically capture every click.
Included in Pro and Scale. Pro starts at $19/month.
A crawler can make a quiet site look busy. StepMetrics uses advanced bot filtering to catch known crawlers, browser automation, and activity that’s too fast to be human. Identified bots stay out of your reports, and you can inspect the traffic that was filtered. Visits with signs of engagement are labeled separately from visits we can’t verify.
No bot filter catches everything. “Unverified” means we don’t have enough evidence either way. Filtered traffic is kept for the same retention period as the rest of your data.
Excluded from standard reports. Still available to inspect.
The browser reported an interaction or sustained page visibility.
Not enough evidence either way. These may still be real people.
StepMetrics checks your site and emails you when it goes down and when it comes back. The outage history is there with your analytics, so you can check whether a dip in traffic happened while your site was unavailable. It’s included on every plan.
There is nothing to set up. Monitoring starts on its own the first time a real visitor loads your site, and we check the page visitors open. Two failed checks in a row trigger an email. The outage record includes the time and the error we received.
acme.example failed two checks in a row.
HTTP 503 · Service Unavailableacme.example passed two checks in a row.
Illustrative email summaries, not screenshots of sent messages.
Create a free account, add a site, and ask your coding agent to install the tracker for you. It puts the script where it belongs in supported projects, or hands you a script tag to add yourself. Visits start arriving as soon as you deploy.
Once the tracker is running, visits and pageviews appear in your dashboard.
Add custom events for signups, purchases, or other actions. Connect your agent through MCP when you want it to read your analytics.
See where visitors come from, which pages they spend time on, and where they leave before completing an action. Explore the dashboard yourself or ask a connected AI agent to look into the numbers.
Yes. Once the website tracker is installed, it records scroll depth and time with the page visible automatically. See how many readers reach the bottom and which pages hold their attention. You can also name sections to measure how people move through a page. Explore page reading reports.
See referrals from AI tools when they pass a referrer, then explore the pages those visitors land on and the conversions recorded for their visits. Links without a referrer or campaign tag appear as Direct, so this is not a complete count of every visit influenced by AI.
Use traffic sources and landing pages to understand which pages attract visitors from search engines. Review recorded conversions alongside that traffic to see which visits lead to useful actions. Search Console query reports are not currently integrated.
Add UTM tags to your campaign links to distinguish sources, mediums and campaigns. Use those segments to investigate visits, landing pages and recorded conversions, so you can compare the traffic your promotions bring.
Yes. The dashboard refreshes live activity automatically, so you can follow incoming visits without repeatedly reloading the page.
Create a funnel from the pages or events that matter to your site and see how many visitors reach each step. On a plan with clickstream, inspect recorded event trails for more detail. Funnel steps must fall within a 24-hour window. Read the measurement limits.
StepMetrics identifies automated traffic and keeps detected bots out of your visitor reports. You can inspect the filtered activity when investigating a spike. No filter catches every bot, and traffic without enough evidence remains unverified. See how bot filtering works.
No. You can use the dashboard on its own. If you work with an agent, connect it through MCP so it can query your analytics too.
Web analytics, conversion funnels, uptime monitoring, agent telemetry, and MCP access. Free includes 200,000 events per month, 2 sites, and 400-day retention. Compare plans and event limits.
The website tracker collects pageviews automatically. Add custom events for successful signups, form submissions, downloads or purchases; these actions are not all detected automatically. Purchase events can include an amount and currency. Server-reported purchases do not automatically join the buyer’s browser visit. See how to track conversions.
Yes. iOS, Android, and React Native apps can send events to the same collection API. This requires adding API calls to your app; web and app reporting can share a site. See mobile integration examples.
Visitor totals are distinct per day, because visitor identifiers rotate daily. Funnels and returning visitors follow a browser by a first-party cookie instead, so they count across days; a browser that blocks the cookie is left out of returning visitors. Cross-site visitor totals count a person separately on each site. Raw request telemetry, including IP addresses and user agents, is retained for analysis. Read the measurement limits.
Add your first site for free. See where visitors come from, what they look at, and how many take the next step.
No credit card required.
Ask us about setup, plans, or anything we haven’t covered here.